Monday, March 10, 2014

Mindset? Intelligence? Politics?


The impetus for this post may seem unrelated to the bulk of the thing, but I try to tie up all the loose ends at the end. I started writing this because I am frustrated with how political/philosophical discussions are very rare, invariably contentious, seldom fruitful, and almost never worth having... and how almost any conversation I have (outside of a classroom) is thereby reduced to routine pleasantries, empty courtesies... just wasted time and wasted breath. But before I could adequately address this, I realized that needed to talk in some detail about attributions/mindsets, intelligence qua situated cognition, and politics qua rooting for your favorite team. This is a loaded post, and in more ways than one (see the title).

Do you believe that a person's basic abilities---e.g., their intelligence, their talents---are fixed traits? That people possess a certain amount of intelligence, say, which is more-or-less stable across the lifetime? Or do you tend to believe that these qualities can be developed through effort, good teaching, and persistence? That everyone can have these abilities and achieve if they work at it?* It may surprise you that the former outlook, termed a "fixed" or "entity" mindset, is endemic in America today, while the latter, a "growth" or "incremental" mindset, is more common in collectivist cultures. This distinction is championed by psychologist Carol Dweck, whose research on this subject been widely influential in recent years.

Because we often don't have any conscious awareness of our mindset, it is tough to make a candid determination and usually requires some roundabout self-experimentation. Here's a quick gauge: when you experience failure, how do you take it? Just imagine past failures and try to remember how you responded at the time. Did you react strongly (inwardly or outwardly), become despondent, or give up quickly upon experiencing difficulties? Did it bother you so much that you refused to even acknowledge the failure, effectively convincing yourself that it never happened? Do you dread failure, even now? Do you spend a lot of time trying to appear smart, capable, talented, etc.? When you were a child, were your cultural spokespersons (your teachers, your parents) telling you things like "you're so smart, you're so talented, so this and so that" instead of "you worked so hard, you learned so much, all that practice really paid off!"

If your answer was "yes" to any of the above, chances are good that you, like me, have a "fixed" mindset. It is our unconscious tendency to interpret our successes and failures as evidence either supporting or disconfirming our possession of certain "abilities". To someone with a fixed mindset, if you fail at something, you are probably bad at it. And while this may sound somewhat reasonable on the face of it, such a policy can be extremely pernicious. Imagine young schoolchildren all across the country who, upon receiving poor scores in math, have learned it's OK to simply repeat the culturally normative, socially acceptable phrase "I am bad at math." The fixed mindset breeds and perpetuates a crippling cycle of defeatism; when you get a bad math grade and say "I got this grade because I am bad at math," you are telling yourself that trying to improve would be pointless. After all, you are "bad at math." That's just who you are, and there's nothing you can do about it. But then, when your next grade is just as bad because you didn't put forth any effort, all you see is more evidence that you really are bad at math. "See, another bad grade. I told you that I'm not a math person!" Though it may sound eerily familiar, this sort of thinking can have tragic consequences: when people start attributing negative outcomes and experiences to internal, stable, personal factors, they come to believe that they are powerless to change their situation. They have slowly convinced themselves of their permanent helplessness, and they make no attempt to better their circumstances.

I've taken math as my pet example for fixed-mindset here because these delusions are nigh ubiquitous. In the United States, most people believe that only a few "gifted" individuals "have what it takes" to learn math, and that hard work can't compensate for this. To someone with a growth mindset, however, failure just means that you need to improve. Studies have shown that, when asked to explain why some children do better in math than others, Asian children, teachers, and parents point to hard work, while their American counterparts point to ability. But this post isn't about math; it should be obvious by now that mindset influences almost every aspect of a person's life--especially how they face challenges and cope with setbacks.

Another familiar hazard of the fixed mindset is something called the fundamental attribution error, the almost universal tendency overemphasize the role of someone's personal traits---their disposition, character, or personality---when explaining their behavior. For example, if someone walks by with an unfriendly phiz, we are more likely to think "that guy's an asshole" than we are "that guy's having a rough day." As a species, we find it easier to think in terms of fixed traits than in terms of situational factors... static adjectives and nouns (e.g., "smart person") make for easier mental labeling  than do dynamic verbs ("worked hard"). Entity attributions like "I am an intelligent person" are difficult to maintain in the face of difficulties, whereas growth attributions like "I succeeded or failed because of my effort" place greater responsibility on the person-in-situation and lead to greater motivation.

To get a little meta for a moment, saying things like "I have a fixed mindset" is totally diagnostic of a fixed mindset... if you believe that it cannot be changed.
While acknowledging your mindset doesn't confer any immediate immunities---I'm as guilty as anybody of misplaced attributions---but it can change your perspective on things like intelligence, ability, and talent. These are sensitive subjects, particularly when conceived of as deterministic traits in a larger dialogue framed in terms of individual/group differences. The chief limitation comes from the tendency to think of people and situations as independent entities rather than seeing people-in-situations as integrated systems; this attitude leads us to look for talent/intelligence/ability in the heads of those we consider talented, intelligent, and able, which is flagrant dualism-- completely circular logic hobbled by the fetters of fixed mindset. Some hallmarks of this conception, which is as widespread as it is outmoded, are sayings like "there's a birth lottery for intelligence" or "a study proved that the heritability of IQ is 95% such-and-so."*

So the traditional notion, the commonly held belief that some people are "smart" while others are "dumb", is strongly echoed by the "find the gifted child" model of talent development. I want to share with you a supremely apropos account of a student who was selected to attend an intensive academic summer program for "talented" students. This program was designed around progressive educational strategies which emphasized collaboration, discovery learning, and creativity. Despite the fact that she was a model student and by all accounts highly intelligent, her performance in the program was extremely poor and her social interactions deteriorated. Discussions with her concerned instructors revealed that she was completely out of her instructional element! She was very uncomfortable in this classroom full of bright suburban students, and she had a strong preference for the lecture format used in her high school. In the traditional conception, her performance (in a technologically rich, well-designed curriculum) was below average, and therefore she had low ability. After adjustments were made to address this, her performance improved significantly. Thus, a better explanation of "ability" here is that her potential to act was a poor fit for this specific environment, and as a result the person-situation interaction did not support the emergence of "talent".

The point is that people perform differently in different settings! To take another striking example, the Adult Math Project (Lave, 1986) found that during price arithmetic calculations, shoppers almost never made an error, while the same individuals averaged only 57% correct on comparable math problems in a testing situation. The reason for these differences, in Fancy Jargon, is that different features of the environment afford activities for an agent who has appropriate effectivities. Just think about how differently you perform when you are in comfortable, familiar situations versus when you are in uncomfortable, unfamiliar ones; intelligence is not a thing that you possess, but a thing that arises from the dynamic transaction among the individual, their previous experiences, their physical environment, and the sociocultural context.
 "A learner's ultimate understanding of any object, issue, concept, process, or practice, as well as her ability to act competently with respect to using these, can be attributed to, and is distributed across, the physical, temporal, and spatial occurrences through which her competencies have emerged" (Barab and Plucker, 19xx).

I'm pretty far afield already, but think for a minute about the instructional implications of all this. All too frequently, the learning taking place in a classroom context contributes to knowledge that is inert during interactions outside of the school walls. Fortunately, there have been movements that stress ongoing participation and aim to develop contexts within classrooms that aid students in learning the material in a manner consistent with those situations in which they would use the material outside of school.

OK, wait, so what was the point of all of this about mindsets and attributions if I wanted to talk about how people discuss political and philosophical topics? I believe that the fixed-mindset perspective has grim implications for the way people discuss, debate, or otherwise compare their ideas. Concretely, if I assert something in front of fixed-mindset folks, then the idea or belief I have articulated is assumed by default to be some fixed and immutable aspect of me, with people either becoming supportive or defensive depending on whether they agree or disagree. In these interactions, we assume that the other party is unwilling, perhaps even unable to change the belief they just expressed, when in fact they may feel no strong attachment to any of their beliefs... I know that countervailing evidence could cause me to change a false beliefs in an instant, even if it's a false belief I happened to have been proud/fond of. When someone brings up their ideas, beliefs, or pet theories, they are not necessarily aggressing or competing or initiating a stand-off... when I bring up my feelings about a political issue, I am not marching my views forth like soldiers into battle; I am submitting them to you as incomplete-yet-personally-compelling hypotheses that I want new/different perspectives on. Views that I want your perspective on. Yet people become automatically, acutely, viscerally defensive, because they identify so strongly with their mostly arbitrary belief system... "I was raised a Libracratic Conservican, therefore the things I believe are A, B, and C!" ...and they assume that I must likewise be passionately attached to my own. Saying something that might be inconsistent with A, B, or C is tantamount to declaring war on their side, because the American way is to reduce even serious issues like ethics and governance to games of sport. Instead of having a rational discussion, we can mindlessly scream Go My Team! Boo Your Team! and feel like we've actually accomplished something.

So just because you hear me say "I think X, Y, Z", please try not to create a mental model of Nathaniel that has X, Y, and Z fixed beliefs. I believe in nothing 100%, I try to have no irrational attachment to my beliefs just because they are my beliefs, and I relish adopting new beliefs when compelling arguments are available.


*Nota bene: I am NOT asking for your opinion on "Nature vs. Nurture", which is an over-hyped and unproductive false dichotomy. If you actually know what you're talking about---e.g., no anecdotal assertions about your family, etc.---and are prepared to discuss norms of reaction and phenotypic plasticity, then OK we can do that sometime. 

Wednesday, February 26, 2014

The Piteous and Worsening State of Keller's Academic Decathlon Program

I am writing to voice my concern about the seriously decrepit state of Keller High School's once eminent Academic Decathlon team.

It's been six years since I competed, but every February, about three weeks in, some sort of high school atavism reminds my unconscious that Academic Decathlon just had its Texas State meet and urges me online to acadecscores (which may be down; the servers are spotty this time of year...) to review the damage. Just FYI, Texas is historically the second best state for AD (behind California).

Now, since the Whitaker-Blevins-Saner era the old program has really gone to seed, but this year Keller High School came in second... to last place. Second to last place! 27th out of 28 teams! The one-time State Champs roundly trounced by everyone else (except Townview, who almost certainly wasn't fielding a full team)!

So, as a concerned ex-decathlete I pulled all the extant data from past TX State meets into R and made some graphs. Hows this one?


These boxplots show the spread of scores from the TX State meet over the years, with Keller's score in red. (If these are unfamiliar to you, know this: each box represents the middle 75% of all scores at the meet; the dark line in the middle of each box represents the median score for that year; anything outside the dotted "whiskers" is a statistical oddity.) Keller won State in 2005, where the red dot sits right on top of the whisker. Notice, though, that since 2002 KHS had been performing in the upper quartile, a trend which continued until 2009. Also, notice that scores were in decline overall since 2008, with KHS roughly in step with the slump, until this year, which saw a huge spike in scores generally but a huge drop in Keller's performance relative to the median. These are just scores though... what about the rankings?


This plot, while less visually exciting than the one above, shows what place KHS has come in at the State over time (note the reversed y-axis; top is 1st place, bottom is 30th). After a 6-year nosedive, KHS appears to have hit rock-bottom.

Why am I so concerned that I took the time to post all this? In high school, many aspects of my life's trajectory were profoundly altered by this program. Like, in deeply nontrivial, self-actualizing, achievement-propelling ways. It reversed a demonstrably ugly pattern of chronic underachievement and delinquent activity, it allowed me to realize my passion for learning (which appears to have single-handedly determined my career), it introduced me to LOVE! To the person I love, who I wouldn't have met otherwise! This person who I love and who is now my wife! Clearly, I owe a lot of who I am today to this program, and I count it among the most influential aspects of my adolescent development.

The beauty of AD that its very structure necessitates the participation of students with 'A', 'B', and 'C' GPAs; this is a game you literally cannot play without equal representation among GPAs. If a program is invested enough, what this means is that students who show academic promise (e.g., PSAT scores, childhood ability tracking, teacher impressions) but for whatever reason have failed to deliver GPA-wise will be actively sought out and recruited. Now, students like these, like me, who might be failing at the time to fully understand the importance (and beauty!) of academics, get to take individual ownership of their learning in a competitive setting that has nothing to do with the punitive, agency-sapping captivity / turn-in-your-busywork babysitting bullshit characteristic of many a "high school education". No. Instead, you get to teach yourself how to learn, then you learn about interesting things, and then you prove your knowledge in direct competition with other schools while enjoying the camaraderie of self-selected like-minded kids whose success or failure is bound up in your own...many of whom I still respect and associate with to this day (with disproportionately many presently pursuing graduate study at respected universities or doing other, equally enterprising things).

This is not just empty theory I'm spouting; a study by Emerick (1992) identified motivational factors that led to the reversal of underachievement in adolescents previously identified as "gifted". Foremost among these factors was the presence of "a strong intellectual interest pursued outside of school," followed closely by "school classes that allowed for advanced or independent study" (Robinson and Clinkenbeard, 1998). What's more, the program's structure prevents specialization in a given area; instead, you have to be a right factotum to achieve in AD, able to deliver extemp speeches, churn out weighty essays, and suffer grilling interviews with composure, all after taking 7 tests ( ranging in subject matter from math to literature).  Academic Decathlon does a lot of good, reinvigorating the academically aloof, getting kids to love learning on their own, and forcing them to ameliorate those weak-spot subject areas; it's a shame to see Keller's once-redoubtable program tanking so hard.


Emerick, L. J. (1992). Academic Underachievement Among the Gifted: Students’ Perceptions of Factors that Reverse the Pattern. Gifted Child Quarterly, 36(3), 140–146. doi:10.1177/001698629203600304
Robinson, A., & Clinkenbeard, P. R. (1998). GIFTEDNESS: An Exceptionality Examined. Annual Review of Psychology, 49(1), 117–139. doi:10.1146/annurev.psych.49.1.117

Saturday, February 15, 2014

Hey, Eigenface! (DIY face recognition)


I've been recently acquainted with a statistical technique of amazing utility and versatility that has its roots in matrix decomposition, a basic---though profound---concept in linear algebra.

For the purposes of this discussion, we're going to consider it a very elegant way of taking a large, confusing dataset with many variables and transforming it so that you can find patterns based on the correlations among the variables, thus allowing you to describe your data with fewer of them.

Though it comes in several of flavors which go by various names, we'll call it Principal Component Analysis (PCA), and later I'm going to show you how you can use it to implement a sort of computer vision/face recognition thing using either Matlab or GNU Octave.

Before this, though, we need to be comfortable with two concepts: (co)variance and eigen-things. If you are already, SKIP TO PCA or SKIP TO EIGENFACES (this is a very long post).

______________________________________________________

Variance & Covariance

Look at the two datasets below; both have a mean of 50, but different variances. Even if you are utterly unfamiliar with the concept, try to guess which has more variance (i.e., variability):


{48 43 52 57 50}     vs.     {10 25 90 75 50}


The numbers on the right are way more spread out from the mean, right? In fact, if you take each number's distance from the mean, square it, and average those values, you get the variance of the data. So, for the one on the left you have 

= (48-50)2+(43-50)2+(52-50)2+(57-50)2+(50-50)2 
= 4+49+4+49+0 
= 106  [sum of squared deviations from the mean]

And on the right side you have

= (10-50)2+(25-50)2+(90-50)2+(75-50)2+(50-50)2
= 1600+625+1600+625+0 
= 4450 [sum of squared deviations from the mean]

Now divide both by 5 to get the average squared deviation from the mean

variance for left set = 106/5 = 21.2     
variance for right set =  4450/5 = 890


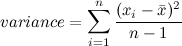
In general, the equation for calculating the variance of a sample of data is


Notice that here, the numerator is exactly what we did above, but the denominator is (n-1) instead of just n. In stat-speak, that's because, in our case, we aren't interested in estimating population variance from our sample; if we were, divided by (n-1) would give a better estimate. In this example, we are effectively treating our sample as a population.

______________________________________________________


Covariance
 
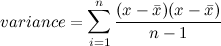
It's helpful to start by thinking of variance this way, expanding the numerator


Variance is only useful when we're dealing with one dimension; often, though, we want to know about relationships between the dimensions. Covariance tells us how much the dimensions vary together:


Seen in this way, variance is just a special case of covariance, where you calculate the covariance of the dimension with itself.

Below are two scatterplots illustrating a linear relationship between two variables; I have included the least-squares line of best fit for each relationship. Even if you are utterly unfamiliar with the concept, guess which relationship has more covariance (i.e., how much the variables change together):


The plot on the left shows a much neater, tighter relationship, with changes in one variable corresponding closely to changes in the other (varying together; heavier people also tend to be taller people); the one on the right, while still having positive covariance (more hours spent on homework tends to result in higher grades), doesn't look quite as tight. A negative covariance would mean that the variables do not change together; that increases in one are associated with decreases in the other.

The covariance for height and weight is 92.03 and the covariance for homework and grades is 5.13; while we should be pretty convinced by this disparity that height & weight vary together more closely than do homework & grades, in order to confirm this the covariances should be standardized. To do this, we divide each covariance by the standard deviation of each of its variables, resulting in the correlation coefficient, Pearson's r. For height vs. weight, r = 0.77 and for grades vs. homework, r = 0.33, confirming our observations.


Covariance matrix 

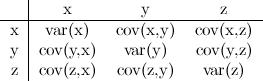
If you have three variables (x, y, z), a covariance matrix for your data is just a matrix with each cell being cov(row,column). It would look like this:


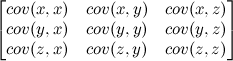
You can see that the diagonal consists of the variance of each variable. Also note that a covariance matrix is redundant, because cov(x,y)=cov(y,x). I'll make it look more matrix-y for you:


These will be crucial later, so keep them in mind.


______________________________________________________


Eigenvectors and eigenvalues

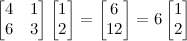
In German "eigen" means "self-" or "unique to", giving us some initial clues--we've got a vector that is unique to something and a value that is unique to something. That something is a square matrix (same # of rows & cols). An vector v is an eigenvector for a square matrix M if, when multiplied by M, it yields a vector that is an integer multiple of v. That is, 

Mv=xv, where x is any integer.


An example should make this clear. Say we have the following square matrix; we want to find the vector [a b] such that x is an integer.


Any such vector [a b] we call an eigenvector of this matrix, and any such integer x an eigenvalue.


Here, [1 2] is an eigenvector and 6 is an eigenvalue of our matrix. These aren't easy to come by, and solving for them by hand is usually infeasible. An n x n matrix will have n eigenvalues. In this case, 1 is the other, and an example of an eigenvector is [1 -3]. See?


OK, that's probably enough to "get" PCA; just remember covariance matrices and eigenvectors, and you're set.

______________________________________________________

Principal Component Analysis

PCA was independently proposed by Karl Pearson (of r fame) and Harold Hotelling in the early 1900s. It is used to turn a set of possibly correlated variables into a smaller set of uncorrelated variables, the idea being that a high-dimensional dataset is often described by correlated variables and therefore only a few meaningful dimensions account for most of the information. PCA finds the directions with the greatest variance in the data, which are called principal components.


Here's a overview/recipe for PCA:

(1) collect data for many dimensions (i.e, variables)
(2) subtract the mean from each data dimension (normalize it)
(3) calculate the covariance matrix
(4) calculate the eigenvectors and eigenvalues of the covariance matrix
(5) decide which dimensions to keep based on eigenvalue
(6) get new data by multiplying transposed eigenvector with transposed data

You wont always get good results when you reduce the dimensionality of your data, especially if it's just to get a 2D/3D graph; sometimes there is just no simpler underlying structure.


I'll walk you through one using data from a class I'm taking; for now, I'm just going to use R so I can provide good visualization. There are three dimensions here (grades, parents education, and homework); note that this is lame/inappropriate data for this sort of technique, but it'll suffice for illustration.


1. here's the data:

 > str(data2)  
 'data.frame':     100 obs. of 3 variables:  
  $ grades: num 78 79 79 89 82 77 88 70 86 80 ...  
  $ pared : num 13 14 13 13 16 13 13 13 15 14 ...  
  $ hwork : num 2 6 1 5 3 4 5 3 5 5 ...  

#let's graph it, too
> library(scatterplot3d)
> s3d<-scatterplot3d(new$pared,new$hwork,new$grades, pch=16, xlab="Parent's Education", 
  ylab="Homework (Hours/Day)", zlab="Grade in Class", type="h")
>
> model <- lm(grades~pared+hwork) #regress grades on parent education and home work
> s3d$plane(model) #here I just fit the regression plane


The OLS best-fitting plane is shown; it minimizes the squared deviations of actual Grades from Grades predicted from Parent's Education and Homework (Hours/Day).

2. now we've got to subtract the mean from each datum:

 > new<-scale(data2,scale=F)  
 >   
 > head(new)  
    grades pared hwork  
 [1,] -2.47 -1.03 -3.09  
 [2,] -1.47 -0.03 0.91  
 [3,] -1.47 -1.03 -4.09  
 [4,]  8.53 -1.03 -0.09  
 [5,]  1.53 1.97 -2.09  
 [6,] -3.47 -1.03 -1.09  

3. ...and calculate the covariance matrix


 > cm<-cov(new)  
 > cm  
      grades  pared  hwork  
 grades 58.110202 4.329192 5.128990  
 pared  4.329192 3.726364 1.098283  
 hwork  5.128990 1.098283 4.224141  

4. ...and calculate the eigenstuff for the covariance matrix

 > eigs<-eigen(cm)  
 > eigs  
 $values  
 [1] 58.946803 4.265718 2.848187  
 $vectors  
         [,1]       [,2]        [,3]  
 [1,] 0.99232104 0.1235818 0.005147218  
 [2,] 0.07967798 -0.6068504 -0.790812257  
 [3,] 0.09460639 -0.7851498 0.612037156  

4.b ...turns out, the princomp function does this all for you! As a sanity check,  lets confirm our eigenguys...

 > pc<-princomp(new, scores=TRUE)  
 > pc$loadings  
   
 Loadings:  
        Comp.1 Comp.2 Comp.3  
 grades 0.992  0.124      
 pared        -0.607 -0.791  
 hwork        -0.785  0.612   

Great, everything looks good!

5. ...check to see which components to keep

 > summary(pc)  
 Importance of components:  
                        Comp.1    Comp.2    Comp.3  
 Standard deviation     7.6391973 2.05500866 1.67919764  
 Proportion of Variance 0.8923126 0.06457269 0.04311468  
 Cumulative Proportion  0.8923126 0.95688532 1.00000000  

A single eigenvector accounts for ~90% of the variance in the data! We'll keep the others around, just to see what happens, but at this point you might eliminate weaker components.


6. ...transform the original data on the basis of the principal components
 
 > scores <- t(eigs$vectors) %*% t(new)   #multiply transpose of eigenvectors by transpose of original, normalized data   
 >  
 > head(scores)  
       grades    pared    hwork  
 [1,] -2.825435 2.7459217 -1.0893718  
 [2,] -1.375010 -0.8779460 0.5731118  
 [3,] -1.927720 3.6546532 -1.6962618  
 [4,] 8.373916 1.7498719 0.8033591  
 [5,] 1.477489 0.6345479 -2.8291826  
 [6,] -3.628543 1.0520404 0.1295553  


Let's visualize our eigenvectors by overlaying them on the transformed data, using the rgl package

 > library(rgl)
 > plot3d(pc$scores)  
 > text3d(6*pc$loadings,texts=colnames(pc$scores),col="red")  
 > coords <- NULL  
 > for (i in 1:nrow(pc$loadings)) {  
 +  coords <- rbind(coords, rbind(c(0,0,0),pc$loadings[i,1:3]))  
 + }  
 >  
 > lines3d(6*coords, col="red", lwd=4)  

The interactive plot is much more convincing, so run it yourself! The eigenvectors are the axes of the transformed data, thus providing a better characterization.

In summary, we have transformed our data so that it is expressed in terms of the patterns between them (lines that best describe the relationships among the variables); essentially, we have classified our data points as combinations of the contributions from all three lines, which can be thought of as representing the best possible coordinate system for the data: the greatest variance of some projection of the data comes lies on the first coordinate (called the first principal component), the second greatest variance on the second coordinate, etc.


______________________________________________________

Eigenfaces!


Many face-recognition techniques treat the pixels of a each face-picture as a vector of values; this one does PCA on many such vectors to abstract characteristic features which can then be used to classify new faces.

Think of an image as a matrix of pixels; let's restrict our attention to grayscale for clarity. Each pixel in a grayscale image is assigned an intensity value from 0 to 255, where "0" is completely black and "255" is completely white. The pictures I am using are 92px by 112px, meaning that there are 92 pixels along each of 112 rows, or equivalently, 112px in each of 92 columns. So, each image comprises a total of 112 * 92 = 10,304 pixels. You can think of each face as a point in a space of 10,304 dimensions! Or rather, you can't very easily think of this, but that's exactly what we've got!

How can we use this information to compute similarities and differences between two pictures? PCA! Take each "row" of pixels in each image and concatenate them to make a single vector of pixel values, like this:

Image vector =<px1 px2 ... px93 px94 ... px10302 px10304>

...where each  "px__" is a single pixel with a grayscale intensity value ranging from 0 to 225. At this point, we have a vector full of numbers... a single dimension. Now, the idea is you take a bunch of these image vectors (made from different images), slap them all into a matrix, normalize them, generate a covariance matrix, find the eigenvectors/values for the matrix, and use these values to measure the difference between a new image and the originals. If the distance is small enough (per some threshold value), then a match condition is satisfied!


I'll show you how all of this works in GNU Octave, but the code should work in Matlab too. In Octave, you need to have the images package installed.

First, we need a "training set" of small grayscale images, all the same size. Many computer vision databases exist, with many such sets to choose from. I'm using 200 images from the AT&T face database (20 subjects, 10 images each).

Here's an example image from the training set, a grayscale image 92 pixels wide by 112 pixels tall (I've got no idea who this guy is):

First, we have to read in all 200 of these images. I have adapted the procedure  from this Matlab source code, which was really great and required only modest modification: here's the exact code I ended up using in Octave v3.8

We then take the mean of all of the image vectors, which results in the following image vector:


Good! Now we subtract this mean image from each image in our training-set and compute the covariance matrix exactly as shown in the discussion above on PCA. The clincher is that for any distribution of data with n variables, we can describe them with a basis of eigenvectors, and because these are necessarily orthogonal, the variables will be uncorrelated.

Below are the eigenfaces*, and boy are they ghastly! Think of them as the pixel representation of each eigenvector formed from the covariance matrix of all images; these faces represent the most similar parts of some faces, and the most dramatic differences between others.


*BTW, I think the first one was mistakenly replaced by the mean image in this picture.


Now that we have facespace, how do we go about recognizing a new face?  The recognition procedure is as follows: once we have projected every sample image into the eigenface subspace, we have a bunch of points in a 20 dimensional space. When given a new image (a new picture of someone in the training set), all we need do is project it into face space and find the smallest distance between the new point and each of the projections of the sample images: of the people pictured in the training set, this gives us the one that best matches the input picture.

I kept one image of each individual out of the training set for a confirmatory test of our eigenfaces. Here's the first and second input image alongside the image reconstructed from their


These graphs show the distance of each input image to each person on the training set (along the x-axis, 1-20); both matched! The first input image had the shortest distance to other images of that person, and so did the second (see the red dot in the figure below)!


I decided to try a picture of myself that was already in black and white, to see if it could reconstruct it; with a large enough data set, it could produce a perfect reconstruction, much in the way that Fourier transforms/decompositions work.


Not good at all, really, is it? I probably screwed something up... this is one of my first forays into GNU Octave and I'm just fumbling my way through someone else's Matlab code. Still, we were able to positively classify two untrained images! That's not too bad for a first go.

What could this technique be used for, practically? It's actually pretty old, and has been largely supplanted by newer, more accurate recognition methods. One immediate use for eigenfaces would be to implement a face-recognition password system for your computer, like these guys did. You can also use it for face detection, not just recognition.

I'm totally trashed; this took me forever! Like 10 hours! I apologize if I have egregiously misrepresented or oversimplified any of the mathematics involved; I'm way out of my comfort zone with this stuff!


If you're interested in this technique, here's a list of webpages I consulted while writing this post:

http://www.bytefish.de/pdf/facerec_octave.pdf
http://jmcspot.com/Eigenface/Default
https://en.wikipedia.org/wiki/Eigenface
http://www.pages.drexel.edu/~sis26/Eigenface%20Tutorial.htm
http://jeremykun.com/2011/07/27/eigenfaces/
http://codeformatter.blogspot.com/